DIRECTORS / OWNERS

Pipeline, win rate, price band — one view.

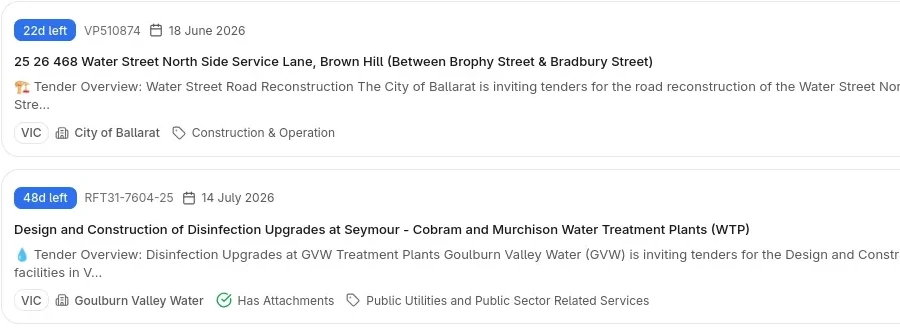
For directors and owner-operators running a tender business. Tendor surfaces the pursuit pipeline, win-rate trend, decision cycle time and comparable price bands from awards intelligence, pre-RFP signals and every buyer your team chases.

DIRECTOR · OPERATING VIEW
Director operating view — pipeline, win rate, days to decide, price variance
WIN RATEROLLING · 12 MONTHS

Public-sector buyers at every level and enterprise · weighted by contract value

PIPELINEQUALIFIED · ACTIVE

14 pursuits live — ten public-sector, four enterprise B2B

DAYS TO DECIDEBID / NO-BID · MEDIAN

From RFT release to recorded pursuit decision

PRICE VARIANCEVS WIN PRICE · ROLLING

Comparable price band tightening with every awarded pursuit

ACROSS · PUBLIC SECTOR · COUNCIL · ENTERPRISE B2BSEE SAMPLE DASHBOARD
WHAT YOU SEE

Four panels. One operating view.

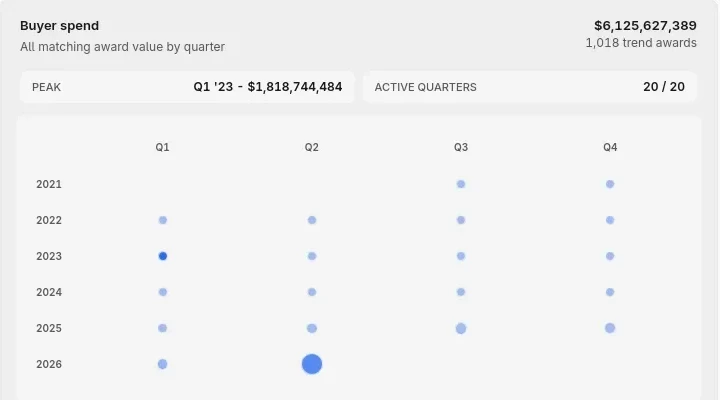
PIPELINE VALUEPUBLIC · ENTERPRISE · ALL BUYER TYPES

Every qualified pursuit, weighted by contract value and stage.

Every buyer type — public and enterprise — in one ledger, weighted by award probability, not the spreadsheet wishlist.

WIN RATE TRENDQUARTER · BUYER · SCOPE · OWNER

Rolling win rate by buyer type, scope and pursuit owner.

Slice by buyer, scope code or capture lead — see where strike rate is climbing, leaking, or needs cover before the next plan.

DAYS TO DECISIONBID · NO-BID · DROP · SUBMIT

How fast bid / no-bid is called — and what it costs to call it slow.

Median days from RFT release to recorded decision, against tenders you actually win — limbo pursuits and over-investments surface early.

PRICE-BAND HEATMAPSCOPE · BUYER · BAND · CONFIDENCE

Comparable price bands, tightening with every awarded pursuit.

Public-sector awards, contracts, council disclosures and enterprise spend — plotted per scope so your next rate-build starts inside the band.

A signal from the field

“Fourteen concurrent pursuits — and ‘where's the pipeline?’ was ‘ask me Friday’.”

$40M contractor, three states, mixed civil and FM. Two quarters in, pipeline, win-rate trend and price band per scope live in one view — board meetings are a five-minute walk-through, not a four-hour reconstruction.

BEFORE / AFTER · $40M CONTRACTOR · 14 PURSUITS
PIPELINE VISIBILITY
Spreadsheet · refreshed Fridays
Live · weighted by buyer
BID / NO-BID DECISION
11 days median
3.4 days median
WIN RATE · TRAILING 12M
31% · all-buyer
67% · all-buyer
PRICE VARIANCE VS WINS
±19%
±8%
CONCURRENT PURSUITS
6 · capacity-bound
14 · library-bound

Composite figures from director-level private-preview accounts. Mix varies by buyer concentration, library maturity and pursuit cadence.

WALK YOUR PIPELINE

Bring your real pursuit list. We will rebuild the operating view against it.

A director-level walkthrough against your actual pipeline — public-sector panels, council frameworks, enterprise pursuits, the lot. We map the pipeline, the win-rate trend and the price band per scope before you commit to anything.